Full-Service Management Spurs Rapid Sales Growth
GO began working with a pet brand in Q2 2022 that had a wide array of products under their belt. They had an incredible following and unshakeable brand loyalty, but many aspects of their business were limiting their sales potential, including meager and inconsistent content, variation challenges, zero investment in advertising, inventory decisions that weren’t beneficial for margin, and a lack of detailed data.
When the brand brought us on board, we knew we could use our strength of being an experienced, full representation agency to help them bring in new consumers and ultimately boost consumption.
The Challenge
Image carousel and A+ content were bare, missing product benefit and value proposition elements that entice new-to-brand (NTB) consumers.
Titles and bullets lacked clarity and consistency, confusing shoppers and resulting in poor customer experiences.
Automatic Variation Systems (AVS) blocked the brand from combining certain items together on the same product detail page.
The brand didn’t have an Amazon advertising strategy, leaving GO to build their approach from the ground up.
They were accepting Bulk Buys from Amazon, negatively impacting margin.
Some desired data pieces, namely sales by category and subcategory, were not available through Vendor Central reporting, restricting the brand’s understanding of which product lines to focus their attention on.
Our Solution
Content:
Added consumer education to their A+ content, image carousels, and Brand Store, such as information about their quality ingredients and award-winning items.
Brought their brand voice and values to the forefront.
Highlighted items that paired well together, bringing more visibility to various products and encouraging cross-selling.
Ensured cohesive copy and branded visuals across their ASINs.
Retail:
Edited their titles and bullets to be clear, consistent, and share the brand’s story.
Fixed/set up 22 variations to optimize the customer experience.
Sidestepped the AVS problem by looking at the items we wanted to variate, going to their backend of item details, and switching all their item-type keywords to the same classification.
Launched 23 new products, giving shoppers more options to choose from.
Advertising:
Ensured the brand’s portfolio was retail-ready before launching Sponsored Ads in July and DSP in August.
Identified best sellers and high-priority ASINs to promote through advertising.
Allocated most of the Sponsored Ad budget toward category and competitor Sponsored Product campaigns to drive brand awareness and incrementality.
Created brand protection tactics via Sponsored Products, Sponsored Brand, and Sponsored Display ads that focused on cross-selling with the goal of upping basket building and average order value.
Utilized DSP to retarget past PDP visitors that did not purchase and encourage repeat purchases to increase LTV and drive trial on a new product segment.
Comparing July to November, the brand increased ad-attributed sales by +269%!
Operations:
Advised the client to stop accepting Bulk Buys.
Reviewed inventory on a weekly basis to ensure we had appropriate weeks of coverage (WOC).
Began submitting Born to Run orders for items that had low WOCs.
Increased purchase orders (POs) and item quantities due to the uptick in consumption spurred by content, retail, and advertising enhancements.
Data:
Crafted custom reporting that analyzed sales by category and subcategory to identify which nodes were yielding the strongest consumption.
Monitored data to influence and pivot strategies including:
Which items should be featured in search ads.
Our promotional strategy in case the brand had excess inventory.
What categories should be supported most through advertising.
If we needed to focus on content updates to drive further sales.
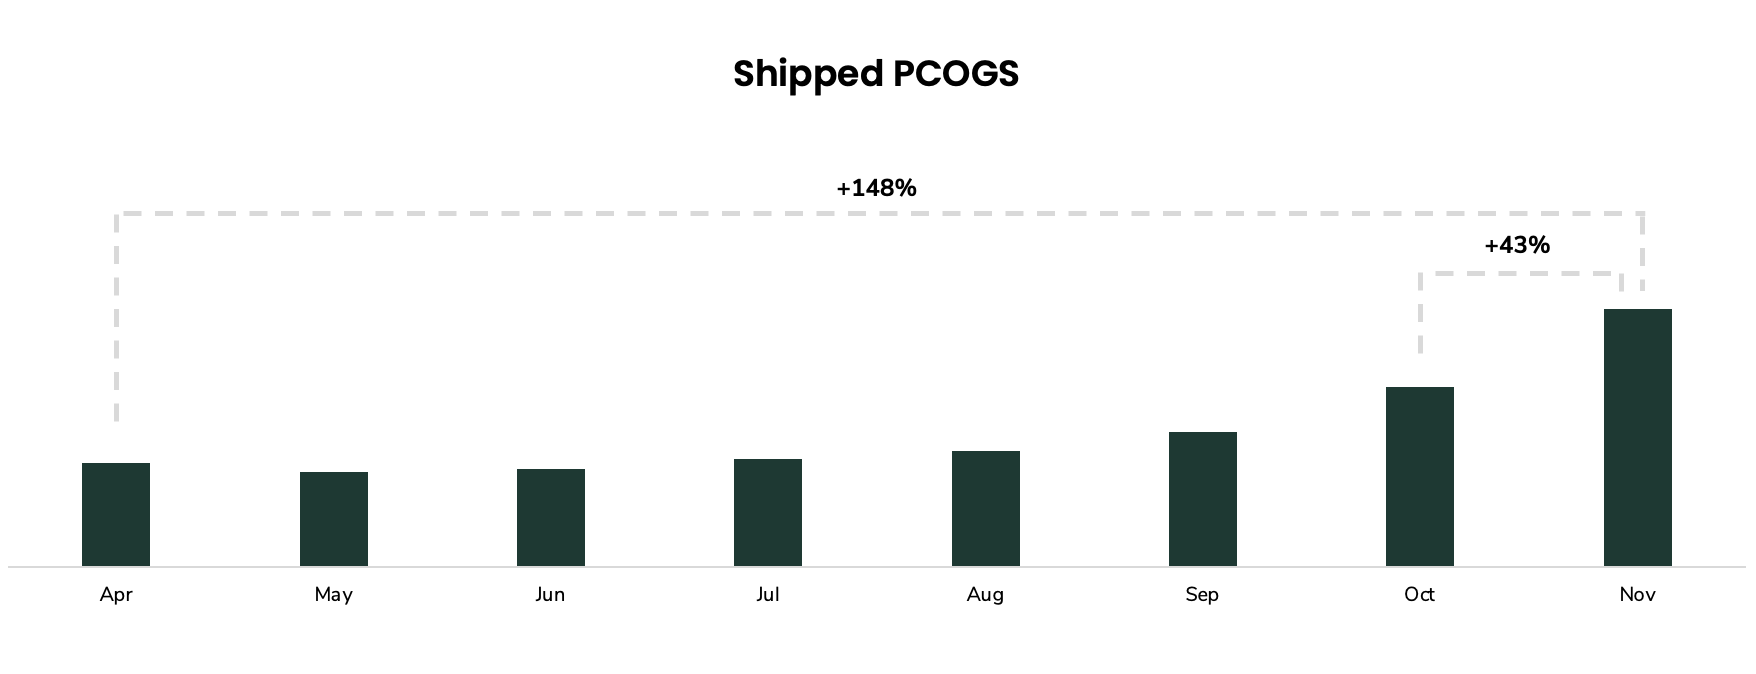
Results
+148%
increase in monthly consumption
in just 8 months
+43%
MoM increase in shipped PCOGS
when comparing Oct. vs Nov.